The advice you follow maximizes growth or invisibly erodes it.
You’ve never been able to see the ongoing impact of each trade because your old portfolios are gone.
See if your past and ongoing portfolio decisions are maximizing growth.
Want to look around first? Explore the demo — no signup, no linking.
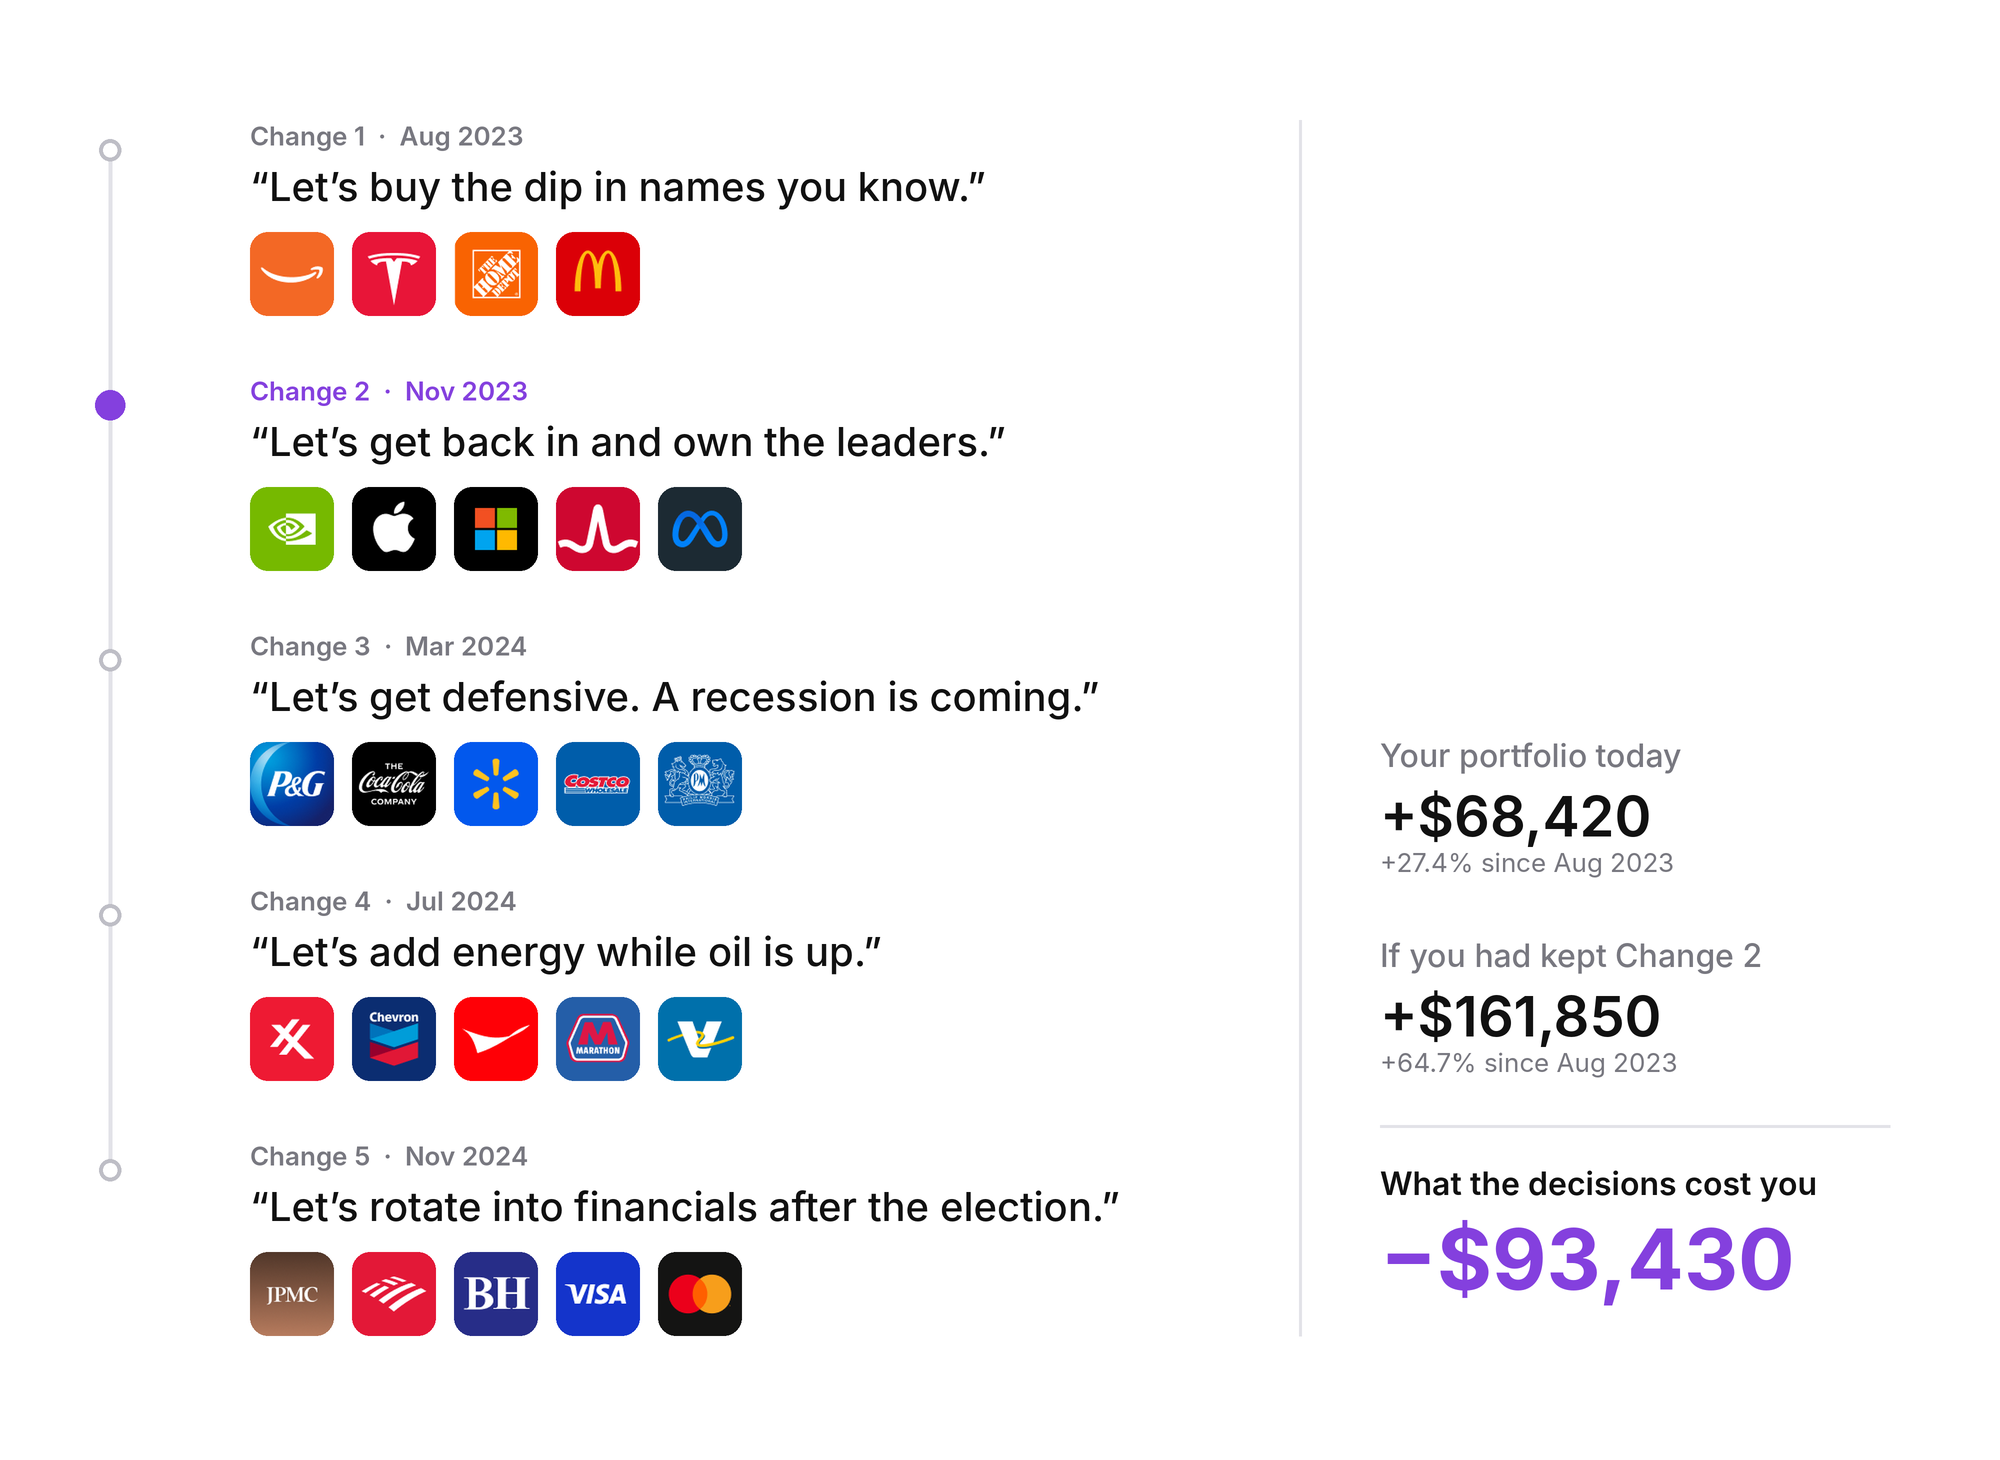
Every change to your portfolio matters. We keep your old portfolios running and benchmark them all so you can compare the current portfolio to previous ones. You now have the clarity to know if the advice you take is actually working.
No matter who you take advice from
Financial Advisor • Robo Advisor • Agent • Self-directed












The trusted second opinion you wished you always had — 24/7.
Decision Benchmark
You'll know if the trade was worth it.
Every time your portfolio changes, the one you had before disappears. You see the new portfolio but have no way of knowing whether the change actually made you better off.
Decision Benchmark keeps the portfolios left behind and continues to run them with daily market prices.
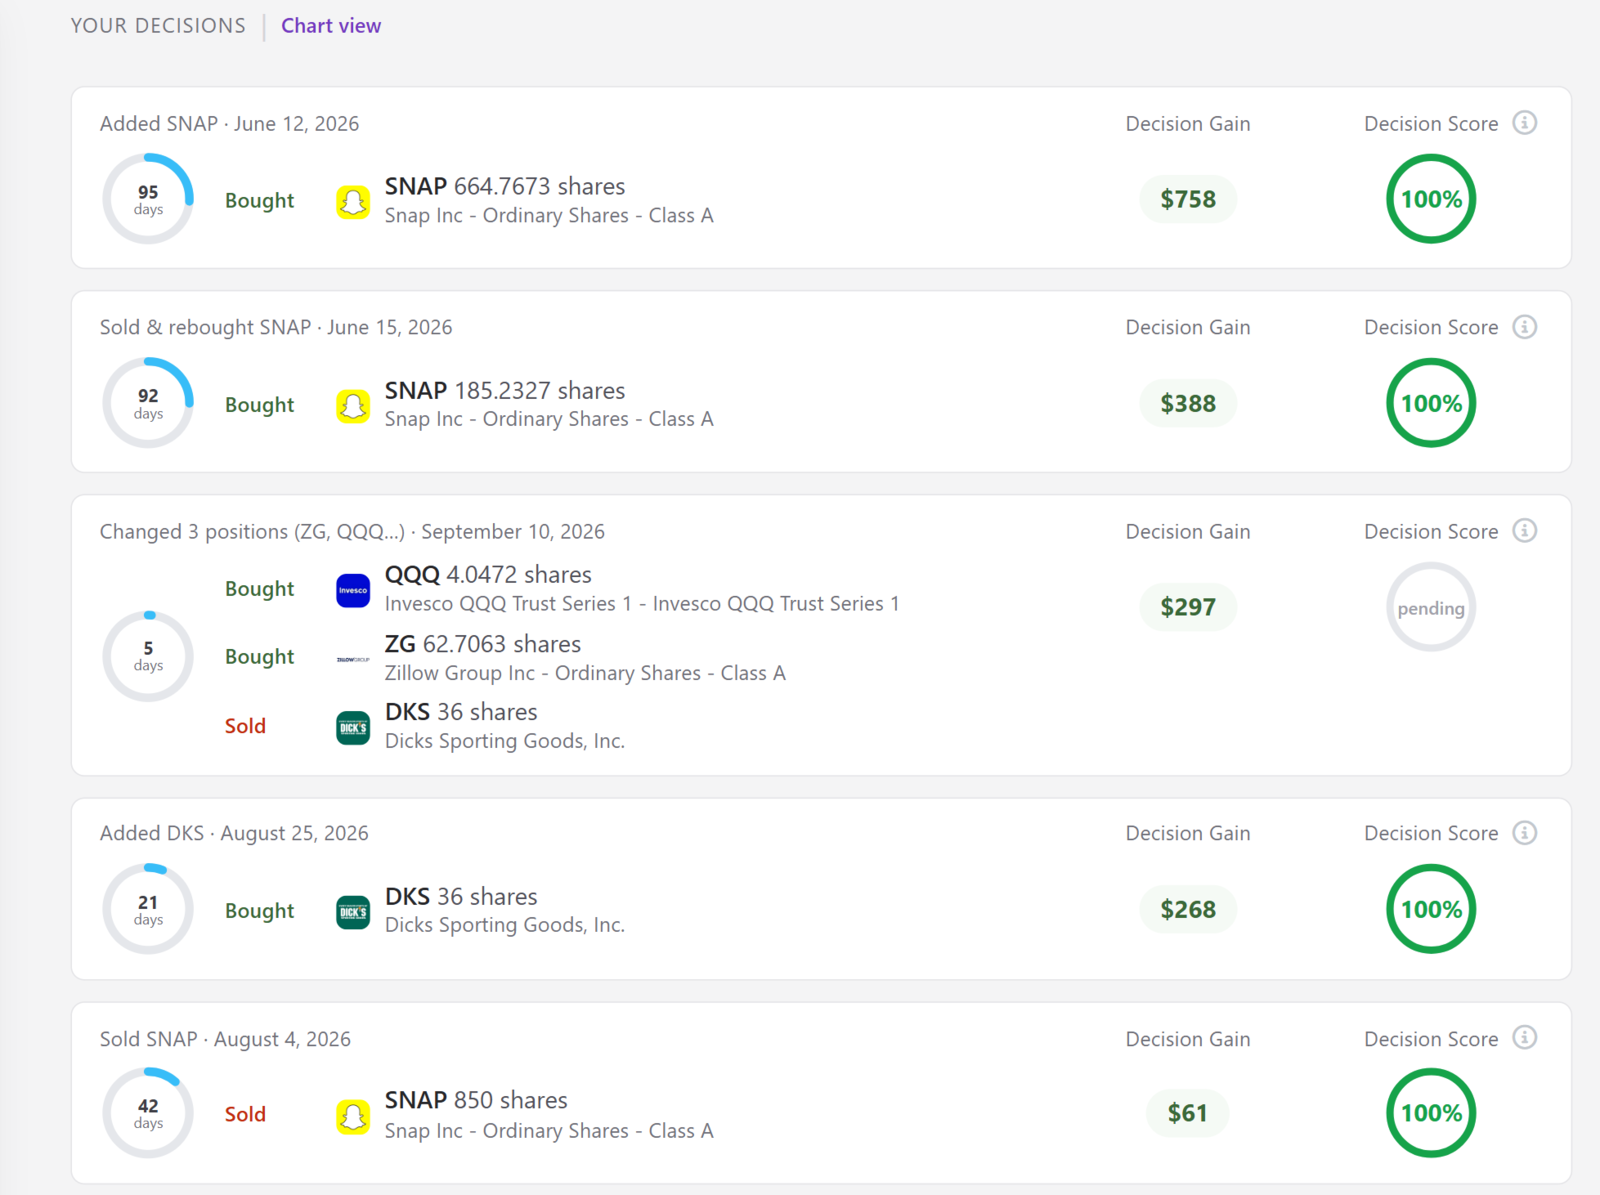
Whether decisions are made by you, your financial advisor, or an AI agent, Decision Benchmark gives you a way to measure the results.
See which decisions are maximizing your growth, which are costing you money, and where things could be better.
Nests
Same firm. Same allocation. A rank you were never shown.
Imagine thousands of investors at your brokerage in your same asset allocation risk model outperforming you. You would want to know why people holding what you hold did better.
Your Nest is that rank, from linked portfolios at your own firm. Advised, it shows how your advisor's results compare with other portfolios like yours. Self-directed, it shows how your own decisions compare with other investors at that firm.
There is always a first and a last. The question is where you sit.
You have not been able to see it.
Now you can.
Drill into your allocation and market cap, or compare your Nest with the same allocation at other firms.
Join your Nest.
Hypotheticals
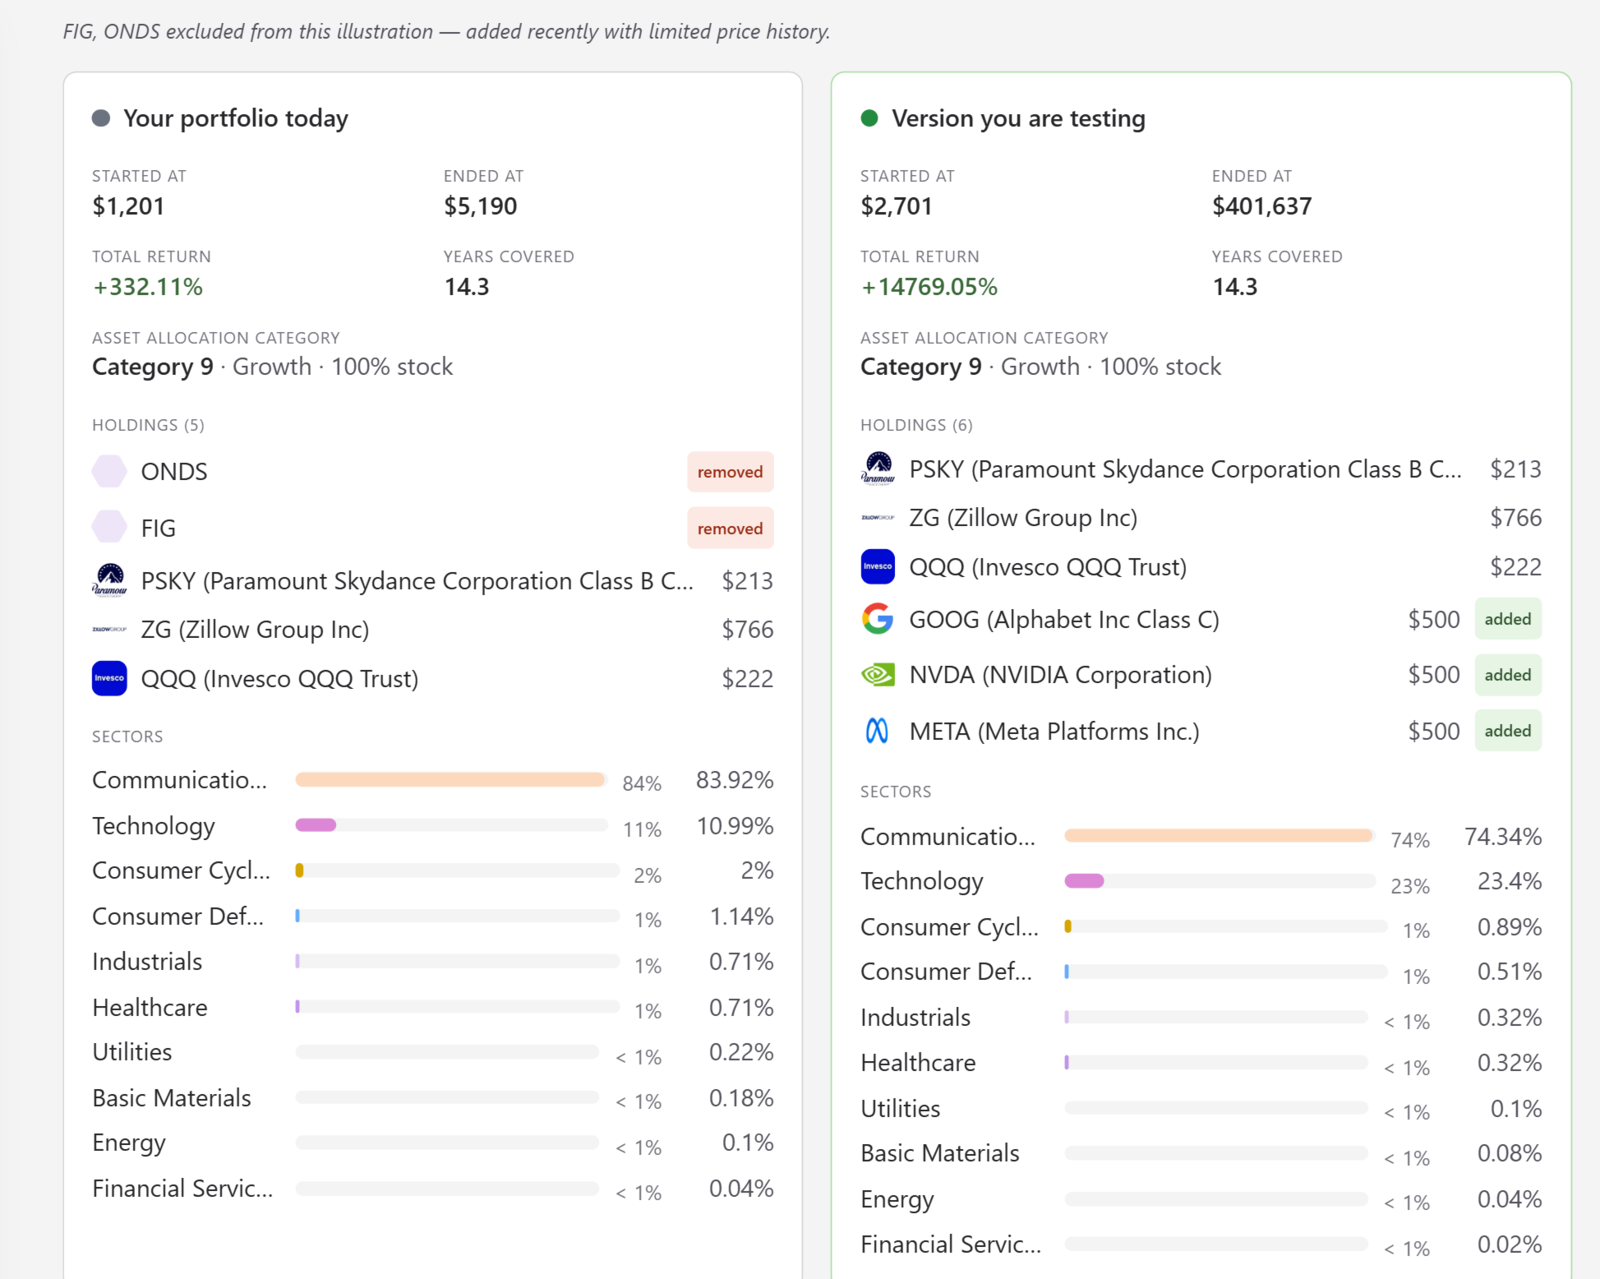
Before you change anything, see how the portfolio you're considering would have compared with the one you have now.
Decision Benchmark answers the change you already made: did it help, or did it quietly cost you? Hypotheticals is for the portfolio you haven't committed to yet.
Add a holding to your current portfolio, or build a new portfolio from scratch. Hypotheticals compares that version with your current portfolio through the same historical period—including the growth and the crashes—so you can see which one grew more, how far each fell, and how each recovered.
You get the clarity to consider a change using real historical data instead of a guess.
See it before you change it.
Cost of Panic
When your portfolio falls, see what happened the last time.
You can watch a portfolio grow for years and still lose ground in a week. The market drops. You sell low. By the time you buy back in, the recovery may already be underway.
The damage isn't necessarily the crash. It's being out of the market when it recovers.
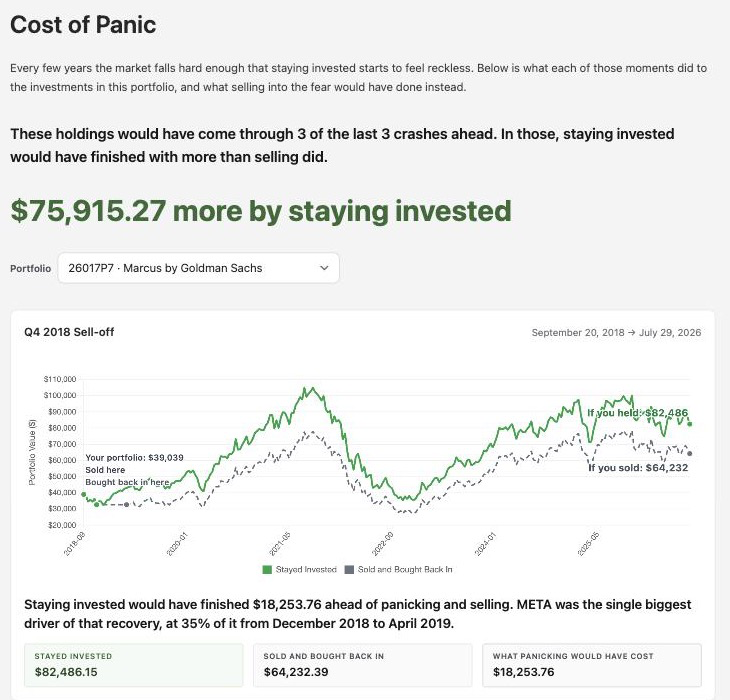
Cost of Panic shows what happened to your portfolio during real market crashes—what you would have had if you stayed invested, what happened if you sold and bought back, and the difference between the two.
And when your portfolio falls to a level that could put you at risk of panic selling, Pure reaches out before you make the decision. You can see how your portfolio handled previous crashes—and that it may be worth more today because you stayed invested through them.
Before you sell, see what happened when you stayed.
Hetty
When you have a question about your portfolio, Hetty, your AI Agent has an answer.
Markets move. Your portfolio changes. And sometimes you just want to know what's happening and why.
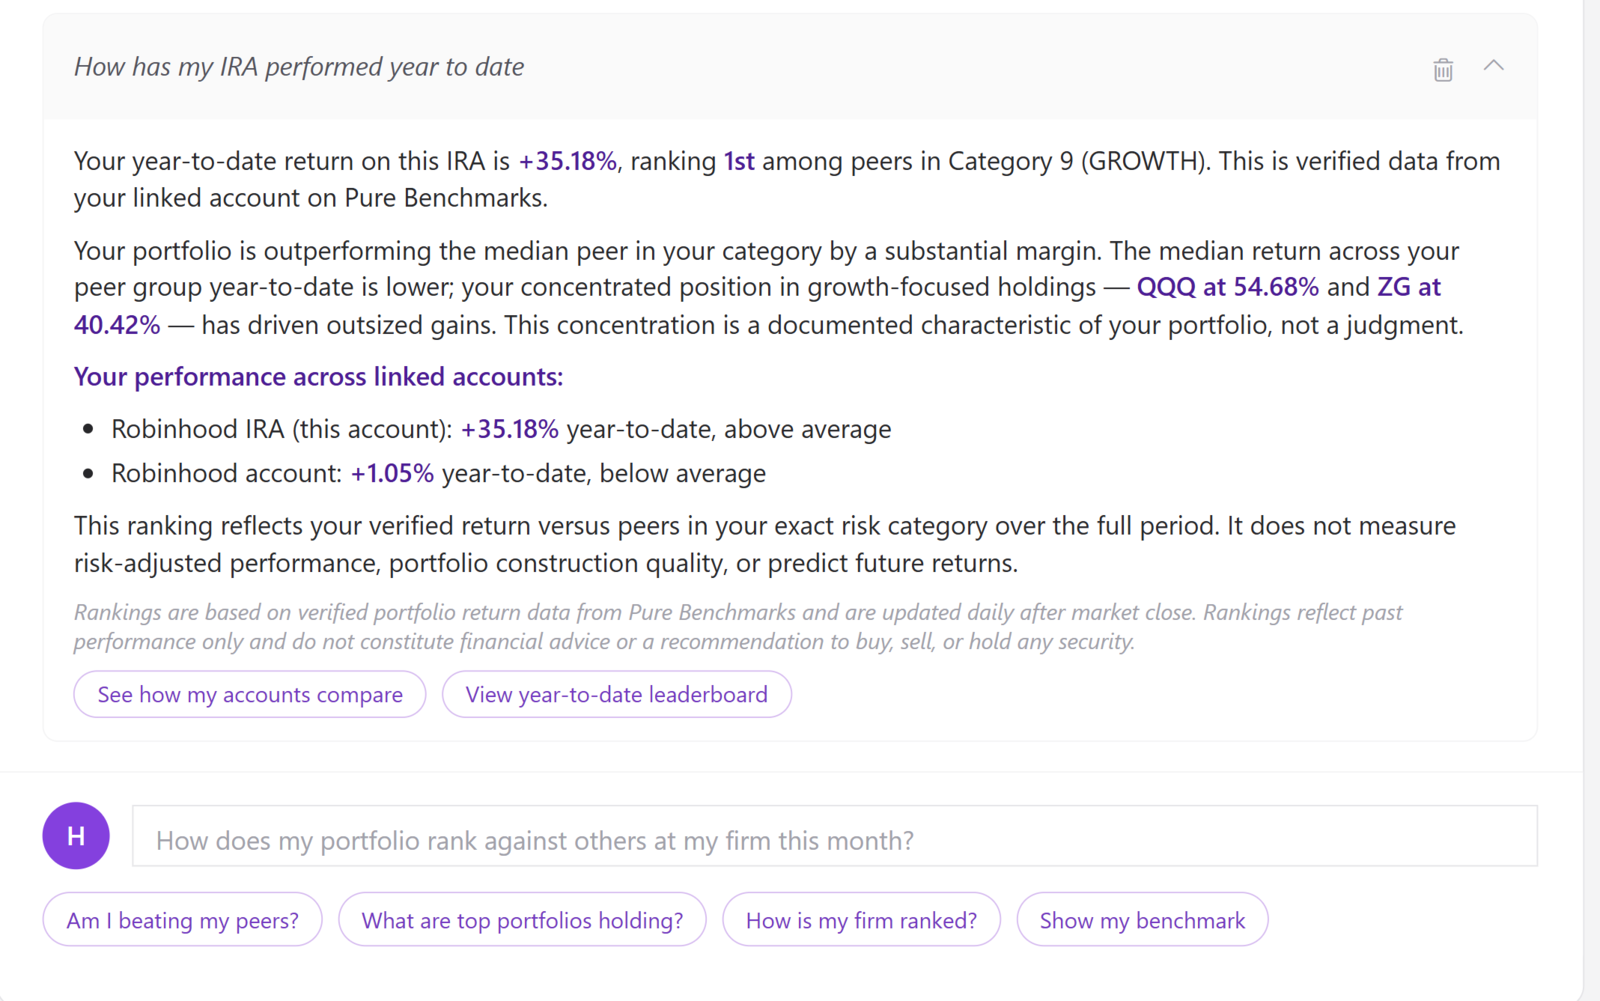
Ask Hetty about any portfolio on the platform and she'll explain it in plain English, compare it with yours, and show you why you're performing better or worse—not bury you in numbers.
When your portfolio takes a significant hit, Hetty can help you understand what happened, including the potential cost of selling and buying back later. She puts the numbers into the context of your actual portfolio and holdings.
And when you need to understand a decision, a benchmark, a Nest, a hypothetical, or what happened during a past market decline, Hetty can explain it.
Your portfolio data. Your questions. Your answers.
Hetty was built with privacy in mind. She only uses the portfolio data needed to answer your question—not your personal information.
Transparency. Clarity. Insight.
You're trusting a financial advisor, a robo-advisor, or now an AI agent with your financial future.
You pay for their advice, their decisions, their expertise. But how do you really know if it's working?
Are their decisions maximizing your growth, or invisibly eroding your wealth?
Until now, you've had to take their word for it.
Now you have a second opinion. One grounded in results, not promises.
Know where you stand. Know what their decisions are costing you. Know when it's time for a change.
Benchmark your decisions now.
Your money stays where it is.
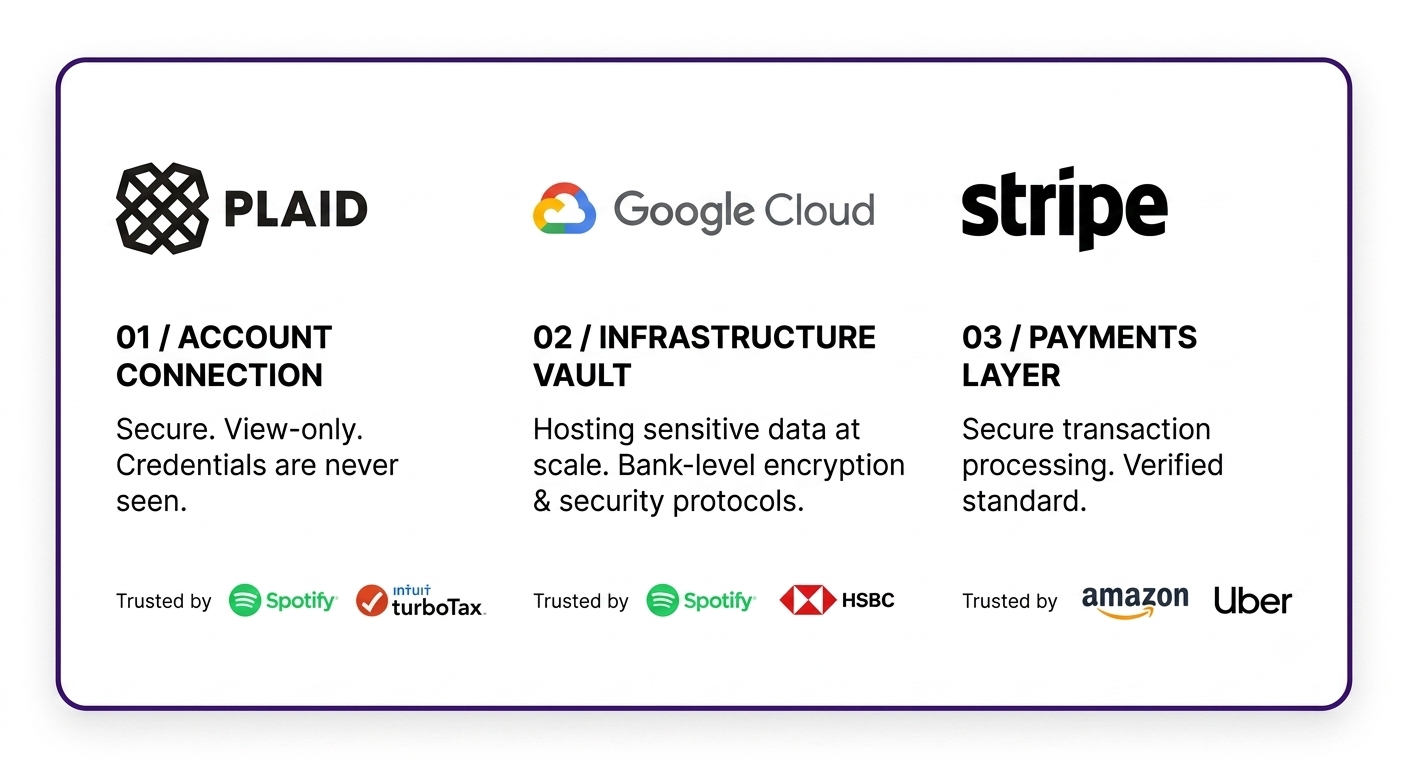
Secure connection. Read-only access. No one can move your money.
Your money never moves. Your data does the work.